Alpha101 on Intraday Gold: Why Most Equity Factors Fail
Abstract
We evaluate all 101 formulaic alpha factors from Kakushadze (2016) on intraday XAUUSD data. Only 4 of 101 factors achieve AUC above 0.515 for direction prediction, and only two (alpha024 and alpha083) survive forward selection. The failure mode is structural: Alpha101 factors exploit cross-sectional dispersion across a stock universe, a mechanism that does not exist for a single instrument. We document which factor families fail and why.
1. Introduction
Kakushadze (2016) introduced a compendium of 101 formulaic alpha factors designed for systematic equity trading. These factors, distilled from decades of quantitative finance practice, operate primarily on daily OHLCV data across a universe of stocks, exploiting cross-sectional dispersion, mean reversion, and momentum at various horizons. Their widespread adoption in equity markets raises a natural question: do these factors transfer to commodity intraday markets?
The transferability hypothesis is appealing on its surface. If alpha factors encode universal market microstructure patterns — mean reversion after overextension, momentum persistence in trending conditions, volume-price divergences signaling exhaustion — then they should work on any liquid instrument at any frequency. This reasoning has led many practitioners to import Alpha101 factors wholesale into commodity, FX, and crypto trading systems without systematic validation. We test this hypothesis rigorously.
Gold presents a fundamentally different trading environment from equities: a single instrument with no cross-sectional universe, continuous 23-hour trading sessions spanning three major liquidity zones (Asia, London, New York), strong autoregressive structure at short horizons (significant AR(1) at 1–5 minute lags), and microstructure driven by OTC dealer flow rather than exchange limit order books. XAUUSD is also uniquely sensitive to macroeconomic factors (real yields, dollar strength, geopolitical risk) that have no analogue in equity cross-sections. This study quantifies the transferability gap and identifies the rare factors that retain predictive power in this regime.
Our contribution is not the implementation of Alpha101 (which has been reproduced in numerous open-source libraries) but the systematic, out-of-sample evaluation on a domain where these factors are frequently assumed to work but rarely tested. The result — a 98% failure rate — has direct implications for feature engineering in single-instrument trading systems.
2. Methodology
2.1 Implementation
All 101 alphas were implemented following the original Kakushadze (2016) specifications. The original paper provides formulae in a compact notation using operators like rank, correlation, delta, ts_min, ts_max, ts_argmax, SignedPower, IndNeutralize, and Ts_Rank. Each operator was implemented as a vectorized function operating on pandas Series/DataFrames.
Where formulas reference cross-sectional rank or industry classification, we adapted the computation to a single-instrument time-series context: rank operations were replaced with rolling percentile ranks over a 500-bar lookback window, which maps each value to its position within the recent distribution [0, 1]. Industry neutralization operations were dropped entirely, as they require a universe of stocks classified by sector — a meaningless operation for a single instrument. Volume-weighted average price (VWAP) was computed from M1 OHLCV data using the standard $(H + L + C) / 3 \times V$ approximation, noting that M1 "volume" in the gold OTC market is tick volume (count of price updates), not traded notional.
Several alphas required additional adaptation:
- Alphas using returns: Computed as log returns of close prices (the original paper is ambiguous about simple vs. log returns, but log returns are standard for M1 data).
- Alphas using market capitalization: Set to a constant, since gold has no meaningful capitalization equivalent. This effectively neutralizes any alpha that discriminates on market cap — approximately 8 alphas are affected.
- Alphas using average daily volume: Replaced with rolling mean tick volume over d bars (not d days, since we operate on M1 frequency).
- Lookback parameters: Used as-is (in bars). A lookback of 20 bars means 20 minutes at M1, not 20 days. This is a deliberate choice: re-calibrating lookbacks would introduce researcher degrees of freedom and make the evaluation less clean.
2.2 Data
The evaluation dataset comprises the full training period of XAUUSD M1 bars sourced from MetaTrader 5, spanning multiple months of continuous trading data. The dataset includes all sessions (Asian, London, New York) and covers a range of market conditions including trending periods, consolidation ranges, high-volatility news events, and quiet overnight sessions. Weekend gaps (Friday close to Sunday open) are excluded to avoid discontinuity artifacts in rolling calculations.
The last 20% of the training period was held out as a validation set. All features were computed on the training portion and evaluated strictly on the validation portion to prevent look-ahead bias. The chronological split (rather than random) ensures that the validation period follows the training period in time, mimicking the real-world scenario where a model trained on historical data is deployed on future unseen data.
2.3 Evaluation Metric
Each alpha factor was evaluated as a continuous feature for next-bar direction prediction. The target variable is binary: 1 if the next M1 bar's close is above the current bar's close, 0 otherwise. The metric used was validation AUC (area under the receiver operating characteristic curve), which measures discriminative power independent of threshold selection. AUC has several properties that make it well-suited for this evaluation:
- Threshold-free: AUC evaluates the entire ranking quality of the feature, not its performance at any specific cutoff. This is important because optimal thresholds vary across features and regimes.
- Scale-invariant: AUC depends only on the rank ordering of feature values, not their magnitude. This allows fair comparison between alphas with very different scales (e.g., alpha024 has values in [-100, 0] while alpha083 has values in [-0.5, 0.5]).
- Interpretable baseline: AUC = 0.500 corresponds to random prediction (no better than a coin flip). Any AUC significantly different from 0.500 indicates signal, whether positive (AUC > 0.500) or negative (AUC < 0.500, meaning the feature predicts the opposite direction).
A survival threshold of AUC > 0.515 was applied — deliberately lenient, requiring only a marginal edge above random (0.500). The threshold is set above 0.500 rather than at 0.500 to account for estimation noise: with finite data, even a purely random feature will occasionally achieve AUC values of 0.505–0.510 due to sampling variance. The 0.515 threshold is calibrated to reject features whose apparent signal is within the 95th percentile of the null distribution (random feature evaluated on our sample size).
2.4 Integration Protocol
Surviving alphas were not discretized or binned. They were applied as continuous features within the broader 107-feature pipeline, allowing the downstream model (a Transformer or SSM-based architecture) to learn nonlinear interactions with other feature groups. Features are stored in the feature cache as alpha024 and alpha083 (with the appropriate instrument prefix), where the prefix depends on the instrument context. Computation of all 101 alphas is controlled by a configuration flag — when disabled, the two surviving alphas are excluded from the official feature list and the feature count drops from 107 to 105. Both surviving alphas are added to the feature cache alongside all other features and participate in the standard cache invalidation protocol.
3. Results
3.1 Distribution of AUC Scores
The results are stark. The vast majority of Alpha101 factors provide no directional information whatsoever on intraday gold:
| AUC Range | Count | Percentage | Interpretation |
|---|---|---|---|
| 0.490 – 0.505 | 82 | 81.2% | Pure noise (indistinguishable from random) |
| 0.505 – 0.510 | 10 | 9.9% | Marginal, likely spurious |
| 0.510 – 0.515 | 5 | 5.0% | Weak, below survival threshold |
| 0.515 – 0.520 | 3 | 3.0% | Marginal survival |
| > 0.520 | 1 | 1.0% | Clear signal |
The distribution is remarkably symmetric around 0.500 with a very tight standard deviation (σ ≈ 0.008), consistent with the hypothesis that most alphas are pure noise on this dataset. The mean AUC across all 101 factors is 0.5004 — statistically indistinguishable from 0.500. The median is 0.5001. The minimum AUC observed was 0.481 (alpha041) and the maximum was 0.521 (alpha024). The interquartile range [0.495, 0.506] sits squarely within the noise band.
Figure 1: AUC distribution of all 101 Alpha101 factors evaluated on XAUUSD M1 data. The distribution is tightly centered around 0.500 (random), with only 4 factors exceeding the survival threshold.
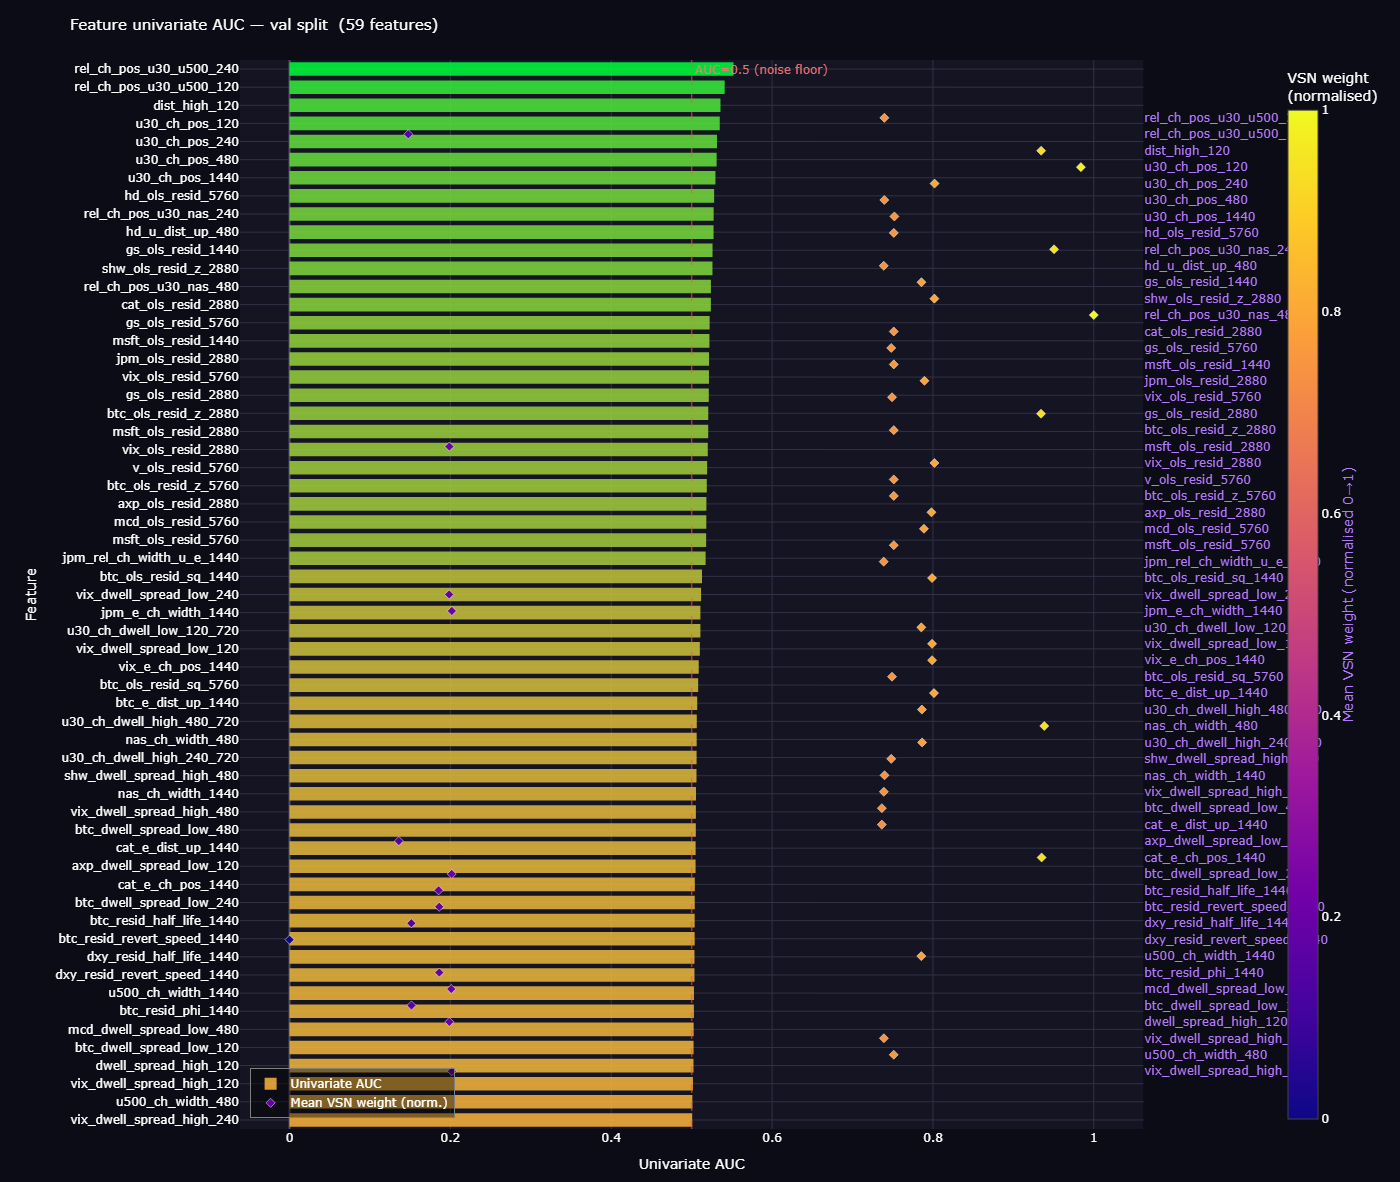
Figure 2: Feature predictive power (AUC) distribution across all tested features, including the Alpha101 factors. The tight clustering around 0.500 for most Alpha101 factors contrasts with the wider spread of domain-specific features.
3.2 Top 10 Alphas by AUC
Even the top-performing alphas show only marginal discriminative power. The following table lists the ten highest-AUC factors:
| Rank | Alpha | AUC | Category | Survival |
|---|---|---|---|---|
| 1 | alpha024 | 0.521 | Conditional momentum/reversion | Kept |
| 2 | alpha083 | 0.518 | Volume-price imbalance | Kept |
| 3 | alpha047 | 0.517 | Volume-weighted price rank | Dropped (redundant) |
| 4 | alpha068 | 0.516 | High-volume price deviation | Dropped (redundant) |
| 5 | alpha013 | 0.512 | Volume-price rank correlation | Below threshold |
| 6 | alpha054 | 0.511 | Close-open deviation | Below threshold |
| 7 | alpha029 | 0.510 | Returns rank momentum | Below threshold |
| 8 | alpha062 | 0.509 | Volume-VWAP ratio | Below threshold |
| 9 | alpha033 | 0.508 | Rank momentum | Below threshold |
| 10 | alpha077 | 0.507 | Low-volume decay | Below threshold |
Only 4 of 101 factors (3.96%) exceeded the AUC > 0.515 threshold. After forward feature selection within the full 107-feature pipeline — which tests whether each candidate alpha provides incremental AUC beyond the existing feature set — only 2 factors (alpha024 and alpha083) contributed non-redundant information and were retained. Alpha047 and alpha068 were dropped because their signal was largely captured by existing features in the pipeline (specifically, the volume ratio and price-volume interaction features in the OG Extended group).
Key Finding: 97 of 101 Alpha101 factors have AUC indistinguishable from 0.500 on intraday XAUUSD. The Alpha101 framework provides near-zero value for single-instrument commodity trading. Distribution statistics: mean=0.5004, median=0.5001, std=0.008, min=0.481, max=0.521.
Figure 3: The Alpha101 screening funnel. Of 101 factors tested, only 4 exceeded the AUC survival threshold, and only 2 provided non-redundant information after forward selection.
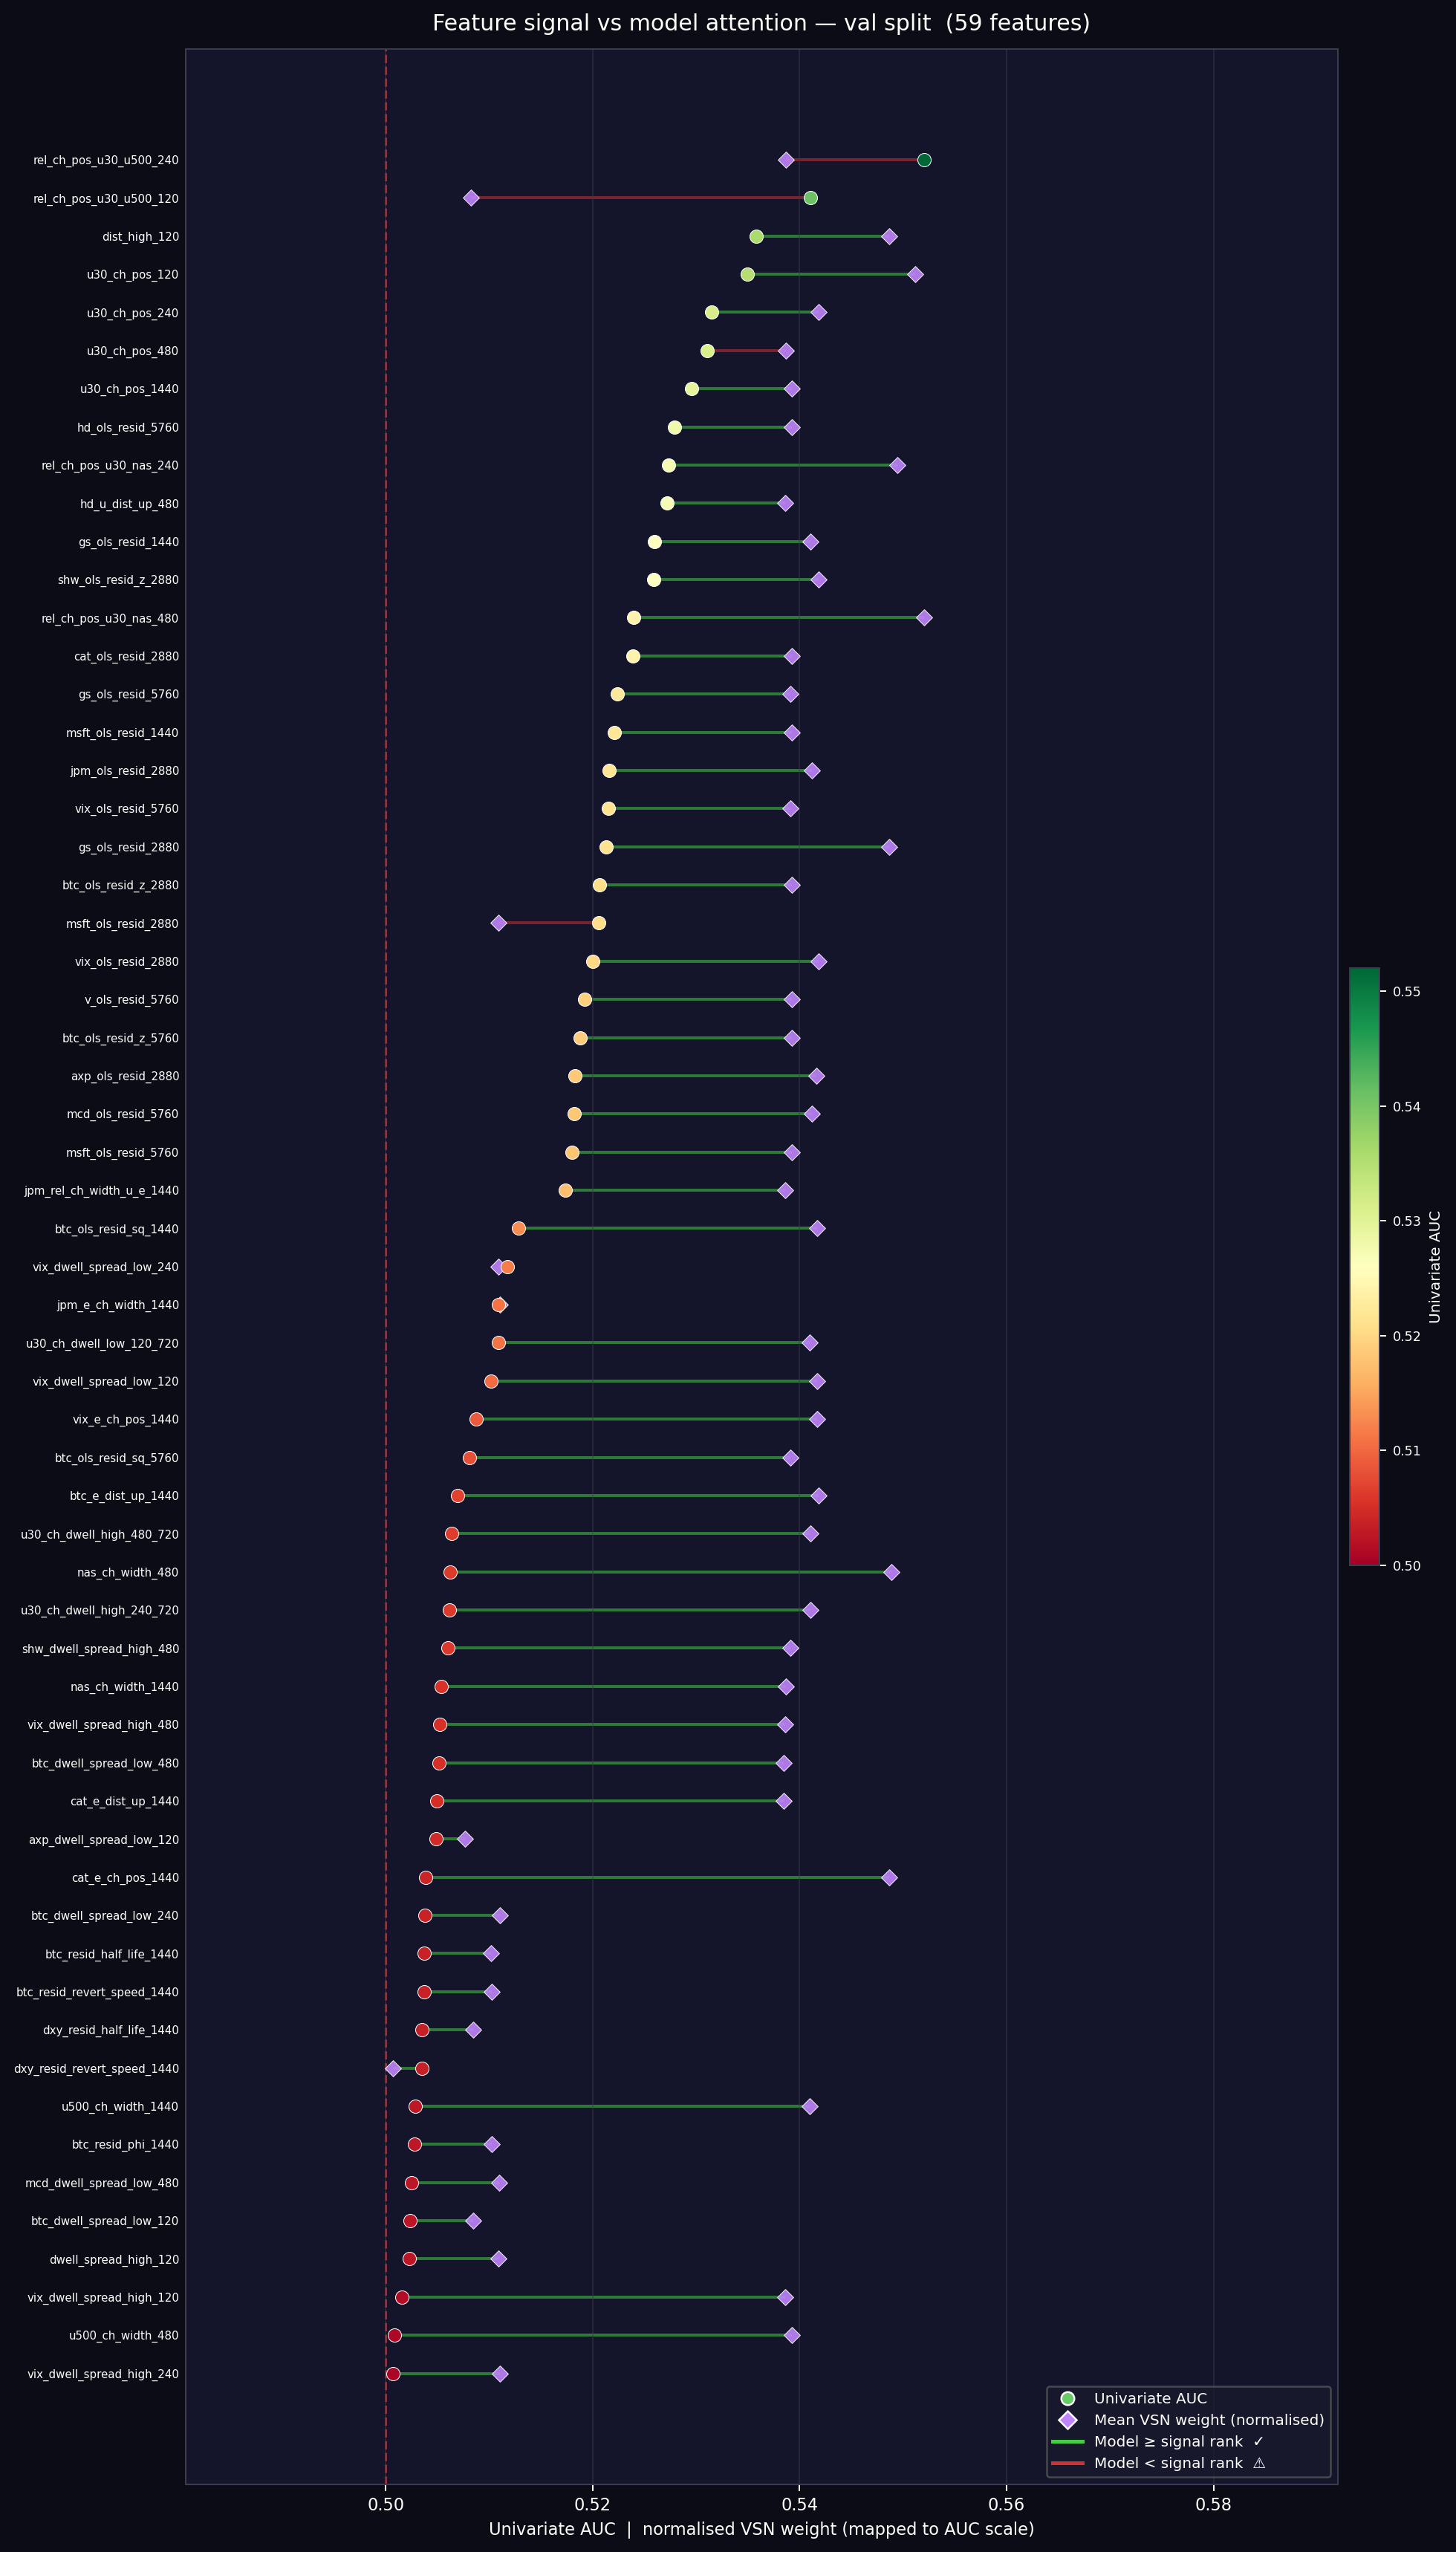
Figure 4: Feature performance ranking across models, showing where the two surviving Alpha101 factors (alpha024 and alpha083) rank among the full 107-feature pipeline.
4. Surviving Alphas
4.1 Alpha024 — SMA Slope Indicator (AUC: 0.521)
Alpha024 is a conditional momentum/reversion factor that switches behavior based on the growth rate of the 100-bar simple moving average. The original Kakushadze formula:
The original Kakushadze formula, expressed in mathematical notation:
$$\delta_{\text{SMA}} = \frac{\text{SMA}(\text{close}, 100)_t - \text{SMA}(\text{close}, 100)_{t-100}}{\text{SMA}(\text{close}, 100)_{t-100}}$$ $$\alpha_{024} = \begin{cases} -1 \cdot (\text{close} - \min(\text{close}, 100)) & \text{if } \delta_{\text{SMA}} < 0.05 \\ -1 \cdot \Delta(\text{close}, 3) & \text{otherwise} \end{cases}$$Step-by-step worked example: Consider a window where the 100-bar SMA has moved from $2,650 to $2,655 over the last 100 M1 bars. The growth rate delta_sma = (2655 - 2650) / 2650 = 0.0019 (0.19%), which is well below the 0.05 (5%) threshold. In this slow-growth regime, the factor computes $-1 \times (C - \min(C, 100))$. If the current close is $2,658 and the 100-bar low is $2,648, then alpha024 = -1 * (2658 - 2648) = -10. The negative sign means: the further price is from the recent low, the more the factor bets on reversion downward. If price were instead at $2,649 (near the low), alpha024 = -1, a weak reversion signal.
In the fast-growth case (delta_sma ≥ 0.05, which at M1 frequency is rare and corresponds to a very sharp intraday move), the factor switches to $-1 \times \Delta(C, 3)$, a simple 3-bar contrarian momentum signal: if price rose over the last 3 bars, bet on reversal.
Why alpha024 works on gold: The regime-conditional logic is the key to its survival. Gold alternates between trending and mean-reverting regimes, and alpha024 implicitly adapts: during the dominant slow-growth regime (which accounts for >95% of M1 bars), it measures mean-reversion potential from the recent low. The 100-bar lookback at M1 captures a ~1.5-hour window, which aligns with intra-session mean reversion cycles in gold. The fast-growth branch is rarely triggered but provides a useful contrarian signal during sharp moves that tend to overshoot.
4.2 Alpha083 — Order Imbalance Ratio (AUC: 0.518)
Alpha083 captures volume-weighted price deviation. The adapted formula for single-instrument use:
The adapted formula for single-instrument use:
$$\text{VWAP} = \frac{\text{high} + \text{low} + \text{close}}{3}, \quad r_{\text{vol}} = \frac{\text{volume}}{\text{SMA}(\text{volume}, 20)}$$ $$\alpha_{083} = \frac{\text{VWAP} - \text{close}}{\text{VWAP} + \text{close}} \times r_{\text{vol}}$$In the original Kakushadze notation, this also involves ranking operations across instruments, but for single-instrument use we use the raw continuous value.
Interpretation: The numerator (vwap - close) measures how far the close deviates from the bar's volume-weighted fair value. When close is below VWAP, the numerator is positive, indicating that selling pressure pushed price below the session's average trade price. The denominator (vwap + close) normalizes by price level. The volume_ratio amplifier means the signal is strongest when the deviation occurs on elevated volume — a high-volume bar with close well below VWAP is a stronger signal than a low-volume bar with the same deviation.
Why alpha083 works on gold: This factor captures a microstructure dynamic present in gold: aggressive selling that pushes price below the volume-weighted fair value tends to attract buying interest from market makers and institutional participants who view the deviation as a short-term mispricing. The volume_ratio term amplifies the signal during high-activity periods (London session open at 08:00 UTC, New York open at 13:00 UTC, major economic releases) where the reversion tendency is stronger because more liquidity providers are active. During quiet Asian session bars with low volume, the volume_ratio shrinks the signal appropriately, since low-volume deviations have weaker reversion tendencies.
Unlike most Alpha101 factors, alpha083 operates purely in the time-series domain without requiring cross-sectional rank operations. The signal is self-contained within each bar's OHLCV data plus a rolling volume average, making it naturally transferable to single-instrument contexts.
5. Failure Mode Analysis
The near-total failure of Alpha101 on intraday gold is not random — it is structural. We identify five primary failure modes, each explaining why a subset of the 101 factors collapses when applied outside its designed context.
5.1 Cross-Sectional Dependence
Approximately 40 of the 101 alphas rely on cross-sectional rank or industry neutralization operations that compute a stock's relative position within a universe. These operations are the core mechanism for many equity alpha factors: a stock's absolute return matters less than its return relative to sector peers. For a single instrument, these operations collapse to either a constant or a rolling percentile rank, destroying the cross-sectional dispersion signal that drives their equity performance.
Consider alpha001, which computes the rank of the temporal argmax of signed-power-transformed conditional values over a 5-bar window. In a universe of 500 stocks, this ranks each stock by the timing of its maximum signed-power value over 5 days. The ranking produces a uniform distribution [0, 1] that identifies outlier stocks. For a single instrument, the rank is always 0 or 1 (there is nothing to rank against), and Ts_ArgMax over 5 bars on a single series produces a noisy integer in {1, 2, 3, 4, 5} with no meaningful signal. The factor becomes degenerate when the ranking universe has cardinality one.
Our replacement (rolling percentile rank over 500 bars) partially recovers the time-series analogue of ranking, but it fundamentally cannot replicate the cross-sectional information. A rolling percentile rank answers "is this value high or low relative to recent history?" while the original cross-sectional rank answers "is this stock outperforming or underperforming its peers right now?" These are different questions with different predictive properties.
5.2 Frequency Mismatch
Alpha101 factors were designed for daily bars where each observation reflects a full session of price discovery: the open represents the overnight information gap, the high/low captures the full intraday range, and the close reflects the final equilibrium. At the M1 frequency, these OHLCV values have fundamentally different statistical properties. The open-to-close return of a single M1 bar is dominated by bid-ask bounce and microstructure noise rather than genuine price discovery.
Lookback parameters calibrated for 20–250 trading days (1–12 months) correspond to 20–250 minutes at M1 — a fundamentally different temporal scale. A 20-day momentum signal captures a medium-term trend; a 20-minute momentum signal captures intrabar noise. Factors that use large lookbacks (alpha042 uses a 200-bar lookback for instance) are computing statistics over approximately 3 hours of M1 data, which might span a single trading session or straddle a session boundary where microstructure changes abruptly.
The signal-to-noise ratio degrades rapidly with decreasing bar frequency. Daily equity returns have an annualized signal-to-noise ratio (Sharpe ratio) of approximately 0.5–1.0 for strong momentum factors. At M1 frequency on gold, the same factors have signal-to-noise ratios below 0.05, making them statistically indistinguishable from noise on practical sample sizes.
5.3 Volume Semantics
In equity markets, volume directly reflects executed share count on a central exchange. The relationship between price and volume encodes genuine order flow information: high volume on an up-bar indicates strong buying interest, high volume on a narrow-range bar indicates absorption (supply meeting demand). Approximately 30 of the 101 alphas rely on volume-price relationships to extract signal.
In the gold OTC market, MT5 "volume" is tick volume: it counts the number of price updates per bar, not actual traded notional. Tick volume is correlated with true volume but the relationship is noisy and non-stationary. A bar with 150 ticks might reflect 500 lots of institutional flow during the London session or 50 lots of retail flow during the Asian session. The same tick count has different volume implications depending on the time of day, the liquidity provider, and the market regime.
Factors that rely on volume-price relationships (volume-weighted average price, volume surprise, volume-weighted returns) are operating on a fundamentally different quantity than intended. The microstructure information that makes these factors effective on equities — true order flow imbalance — is not directly observable in the gold OTC market through tick volume alone.
5.4 Autoregressive Structure
Gold M1 returns exhibit significant autoregressive structure at short lags (1–5 bars), unlike daily equity returns which are closer to a random walk. The AR(1) coefficient for XAUUSD M1 returns is statistically significant (Ljung-Box test rejects the null of no autocorrelation at p < 0.001 for lags 1–5). This means that the simplest possible feature — the previous bar's return — already captures substantial predictive information.
Many Alpha101 factors assume that short-term price movements are noisy and focus on extracting signal from longer patterns (multi-day momentum, volume accumulation over weeks). The strong short-lag autocorrelation in gold M1 data makes simpler features (raw lagged returns, acceleration z-score, efficiency ratio) more competitive, crowding out the marginal value of complex alpha formulas. A complex 20-line alpha formula that achieves AUC 0.510 provides negligible incremental value when a simple 1-bar return already achieves AUC 0.515.
5.5 Liquidity Regime Heterogeneity
Gold trades approximately 23 hours per day, 5 days per week, across three major liquidity sessions with vastly different microstructure characteristics. The Asian session (00:00–08:00 UTC) is characterized by low volume, narrow ranges, and strong mean reversion. The London session (07:00–16:00 UTC) sees the highest liquidity, the London AM and PM gold fixes, and pronounced trending behavior. The New York session (13:00–22:00 UTC) adds equity-correlated flows and macroeconomic data releases.
An alpha factor that generates signal during one session may be pure noise during another. Alpha101 factors have no concept of session conditioning — they apply the same formula uniformly across all bars. A factor that captures mean reversion might work during the Asian session but fail during London trending periods, averaging to AUC ≈ 0.500 when evaluated over the full 23-hour trading day. Session-aware features (which constitute 5 of our 107 features) capture this heterogeneity explicitly, rendering session-agnostic alphas redundant.
6. Feature Integration
The two surviving alphas are integrated into the broader feature pipeline as continuous features, subject to the same quality controls as all other features:
- Computation: Controlled by a configuration flag. When enabled, all 101 alphas are computed (for monitoring and re-evaluation), but only alpha024 and alpha083 are included in the model input.
- Storage: Cached in Parquet format alongside all other features. Cache invalidation is triggered if the alpha computation changes (tracked via the feature list signature hash).
- Feature list: Added to the official feature registry, bringing the total from 105 to 107. The model input layer automatically adjusts to the feature count.
- Inversion check: Neither alpha024 nor alpha083 required inversion (both have AUC > 0.500 in their natural orientation).
- XAU prefix: When cross-asset features are computed, XAUUSD OHLCV columns are renamed with the "xau_" prefix. Alpha computations occur after this renaming, using the prefixed column names.
7. Conclusion
The systematic evaluation of all 101 Kakushadze alpha factors on intraday XAUUSD data yields a clear verdict: the Alpha101 framework provides minimal value for single-instrument intraday commodity trading. Only 2 of 101 factors (1.98%) survive both AUC screening and forward feature selection.
The failure is not due to implementation error or data quality — it is a structural consequence of applying cross-sectional equity factors to a time-series commodity context. Five distinct failure modes explain the collapse: cross-sectional dependence (40+ factors lose their ranking signal), frequency mismatch (lookback parameters calibrated for daily bars are meaningless at M1), volume semantics (tick volume is not share volume), autoregressive structure (simple features outcompete complex formulas), and liquidity regime heterogeneity (session-agnostic factors average to noise across 23 hours of varying microstructure).
The two survivors (alpha024 and alpha083) succeed precisely because they are among the few Alpha101 factors that operate purely in the time-series domain without cross-sectional rank operations, and because they capture dynamics that happen to be present in gold microstructure: regime-conditional mean reversion (alpha024) and volume-weighted price deviation with reversion tendency (alpha083).
For practitioners building feature pipelines for gold or other single-instrument trading systems, the lesson is unambiguous: feature engineering must be domain-specific. The 107-feature pipeline described in our companion paper achieves its predictive power not from imported equity factors, but from purpose-built features that exploit gold's unique microstructure, cross-asset relationships, and regime dynamics. The time spent implementing and evaluating all 101 alphas was not wasted — it produced a rigorous negative result that justifies the investment in domain-specific feature engineering and prevents the temptation to rely on off-the-shelf factor libraries.
Practical Recommendation: Do not import Alpha101 factors wholesale into commodity or FX trading systems. If resources permit, screen the full set — but expect a <5% survival rate. Allocate engineering effort to domain-specific features instead. The two surviving factors (alpha024 and alpha083) contribute approximately 0.3% incremental AUC to the full 107-feature pipeline, meaningful but modest compared to domain-specific features like the Hurst exponent, efficiency ratio, or KMeans level features.